Sunday, September 30, 2012

Charting Last Week (9/24 - 9/28/12)

The Daily Leading Index fell by 2.92% to 2.88%. The decline was largely the result of a 13.2% decline in Durable Goods New Orders compared to the previous month. There was a 101.8% decline in new orders for nondefense aircraft and parts. Without transportation, new orders were down 1.6%. The Daily Coincident Index declined to 2.30%. The Daily Leading Index page on the tab above is updated daily during the week.
Equities were down slightly for the week after being in the overbought territory two weeks ago. Bonds rallied during the week. The red (or green) area indicates 2-3 standard deviations above (or below) the normal 21 day trading range. The gray area indicates 1-2 standard deviations above (or below) the normal 21 day trading range.
All information, data and analysis provided by this website is for informational purposes only and is not a recommendation to buy or sell any security.   Click here for more details.

Furthermore, these charts have limitations.  Economic data is often revised after the fact.  The market is forward looking and anticipates future events.  The unexpected can and will happen.  The market is continually changing.  The conditions of the past are different from the present.  Past performance is not an indication of future performance.

Tuesday, September 25, 2012

Case-Shiller Home Price Index 9/25/12

The S&P/Case-Shiller Home Price Index for July 2012 was released today. The 20-City Composite is up 1.14% compared to July 2011 (seasonally adjusted) and is up 0.44% compared to the previous month. 18 of the 20 cities in the Composite-20 were up in July compared to the previous month. 16 of the 20 cities are now up year over year.


Below is an interactive graph. You can interact with the graph by choosing what to display. The CITY category contains all 20 markets as well as the Composite-10 and Composite-20 index. The choices in the TYPE category are All, Condos, and High, Low and Middle Tiers. The prices of homes in each city are divided into three tiers. Each city has different breakpoints. For example, for the latest release in Las Vegas the Low tier is homes under $118,154 and the High tier is over $182,284. In San Francisco the Low tier is under $344,682 and the high tier is over $626,820. The SA/NSA category allows you to view Seasonally Adjusted data (SA) and/or Non-Seasonally Adjusted data (NSA).

If you left click on a category, the chart will update with only data for that item in that category. If you hold the CONTROL button down while left clicking, it will toggle that item on and off while leaving the other items in that category the same allowing you to add or subtract items. If you hold the SHIFT key down while left clicking, it will add all items in between where you clicked and the item you last clicked. You can clear all selections in a category by clicking the Filter Icon on the top right of each category (looks like a funnel with a X). You can also refresh the page to bring it back to its original state.


All information, data and analysis provided by this website is for informational purposes only and is not a recommendation to buy or sell any security.   Click here for more details.

Furthermore, these charts have limitations.  Economic data is often revised after the fact.  The market is forward looking and anticipates future events.  The unexpected can and will happen.  The market is continually changing.  The conditions of the past are different from the present.  Past performance is not an indication of future performance.

Sunday, September 23, 2012

Charting Last Week (9/17 - 9/21/12)

The Daily Leading Index fell by .23% to 5.80% while the Daily Coincident Index was flat at 2.54%. The Daily Leading Index page on the tab above is updated daily during the week.
Equities were down slightly for the week after being in the overbought territory last week. On the other hand, bonds were up for the week. WTI Crude Oil fell sharply from the overbought territory to the oversold territory. The red (or green) area indicates 2-3 standard deviations above (or below) the normal 21 day trading range. The gray area indicates 1-2 standard deviations above (or below) the normal 21 day trading range.
All information, data and analysis provided by this website is for informational purposes only and is not a recommendation to buy or sell any security.   Click here for more details.

Furthermore, these charts have limitations.  Economic data is often revised after the fact.  The market is forward looking and anticipates future events.  The unexpected can and will happen.  The market is continually changing.  The conditions of the past are different from the present.  Past performance is not an indication of future performance.

Sunday, September 16, 2012

Charting Last Week (9/10 - 9/14/12)

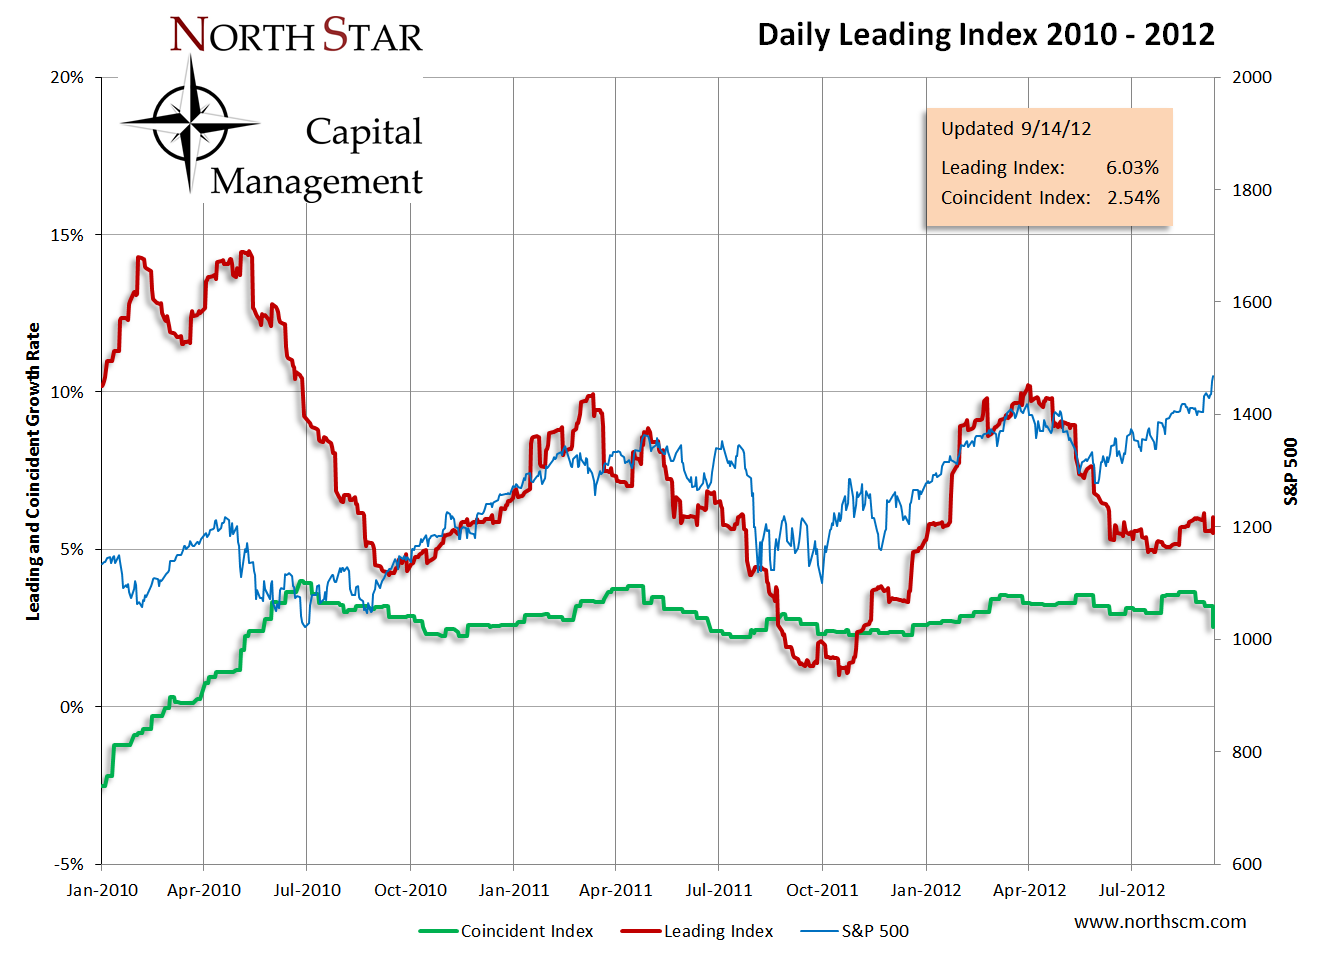
The Daily Leading Index rose by .47% to 6.03% and is now at the top of the tight range it has been in for the last 12 weeks. The Daily Coincident Index fell to 2.54%. The Daily Leading Index page on the tab above is updated daily during the week.
Equities posted strong gains for back to back weeks. All the equity indices are in the overbought territory. SPY (S&P 500) is at an all time high and is now 3.7% higher than the 2007 highs. TLT (Barclays 20+ Year Treasury Bond) is now in the oversold territory. The red (or green) area indicates 2-3 standard deviations above (or below) the normal 21 day trading range. The gray area indicates 1-2 standard deviations above (or below) the normal 21 day trading range.
All information, data and analysis provided by this website is for informational purposes only and is not a recommendation to buy or sell any security.   Click here for more details.

Furthermore, these charts have limitations.  Economic data is often revised after the fact.  The market is forward looking and anticipates future events.  The unexpected can and will happen.  The market is continually changing.  The conditions of the past are different from the present.  Past performance is not an indication of future performance.

Sunday, September 9, 2012

Charting Last Week (9/4 - 9/7/12)

The Daily Leading Index fell by .41% to 5.56%. The Daily Coincident Index fell to 3.22%. The Daily Leading Index page on the tab above is updated daily during the week.
Equities posted strong gains last week. Most indices are in the overbought territory. SPY (S&P 500) is at an all time high and is now 1.7% higher than the 2007 highs. The red (or green) area indicates 2-3 standard deviations above (or below) the normal 21 day trading range. The gray area indicates 1-2 standard deviations above (or below) the normal 21 day trading range.
All information, data and analysis provided by this website is for informational purposes only and is not a recommendation to buy or sell any security.   Click here for more details.

Furthermore, these charts have limitations.  Economic data is often revised after the fact.  The market is forward looking and anticipates future events.  The unexpected can and will happen.  The market is continually changing.  The conditions of the past are different from the present.  Past performance is not an indication of future performance.