Sunday, September 27, 2020

Charting Last Week (9/21/20 - 9/25/20)

The North Star GDP Estimate for the second quarter is -3.14% year over year growth (-10.59% QoQ). The North Star GDP Forecast for the third quarter is at -1.68% year over year growth (22.38% QoQ) unchanged from last week. The GDP Forecast page on the tab above is updated periodically during the week.
The S&P 500 (SPY) fell by 0.58%, declining for the fourth week in a row. Bond prices were mixed for the week. The red (or green) area indicates 2-3 standard deviations above (or below) the normal 21 day trading range. The gray area indicates 1-2 standard deviations above (or below) the normal 21 day trading range.
The Leading Indicator for International Developed Markets (EFA) is at -5.61%. The Leading Indicator for International Emerging Markets (EEM) increased by 0.50% percentage points to 3.26%. On the chart below, you can click on the blue and red buttons to see the Leading Indicator growth rate and an ETF for each country.
All information, data and analysis provided by this website is for informational purposes only and is not a recommendation to buy or sell any security. Click here for more details.

These charts have limitations. Economic data is often revised after the fact. The market is forward looking and anticipates future events. The unexpected can and will happen. The market is continually changing. The conditions of the past are different from the present. Past performance is not an indication of future performance.

Sunday, September 20, 2020

Charting Last Week (9/14/20 - 9/18/20)

The North Star GDP Estimate for the second quarter is -2.79% year over year growth (-11.12% QoQ). The North Star GDP Forecast for the third quarter is at -1.68% year over year growth (21.55% QoQ) unchanged from last week. The GDP Forecast page on the tab above is updated periodically during the week.
The S&P 500 (SPY) fell by 1.02%, declining for the third week in a row. Bond prices were mixed for the week. The red (or green) area indicates 2-3 standard deviations above (or below) the normal 21 day trading range. The gray area indicates 1-2 standard deviations above (or below) the normal 21 day trading range.
The Leading Indicator for International Developed Markets (EFA) increased by 0.47% percentage points to -5.61%. The Leading Indicator for International Emerging Markets (EEM) is at 2.76%. On the chart below, you can click on the blue and red buttons to see the Leading Indicator growth rate and an ETF for each country.
All information, data and analysis provided by this website is for informational purposes only and is not a recommendation to buy or sell any security. Click here for more details.

These charts have limitations. Economic data is often revised after the fact. The market is forward looking and anticipates future events. The unexpected can and will happen. The market is continually changing. The conditions of the past are different from the present. Past performance is not an indication of future performance.

Sunday, September 13, 2020

Charting Last Week (9/8/20 - 9/11/20)

The North Star GDP Estimate for the second quarter is -2.86% year over year growth (-16.31% QoQ). The North Star GDP Forecast for the third quarter is at -1.68% year over year growth (25.49% QoQ) up from -1.80% last week. The GDP Forecast page on the tab above is updated periodically during the week.
The S&P 500 (SPY) fell by 2.48%, declining for the second week in a row. Bond prices were up for the week. The red (or green) area indicates 2-3 standard deviations above (or below) the normal 21 day trading range. The gray area indicates 1-2 standard deviations above (or below) the normal 21 day trading range.
The Leading Indicator for International Developed Markets (EFA) decreased by 1.04% percentage points to at -6.08%. The Leading Indicator for International Emerging Markets (EEM) is at 2.21%. On the chart below, you can click on the blue and red buttons to see the Leading Indicator growth rate and an ETF for each country.
All information, data and analysis provided by this website is for informational purposes only and is not a recommendation to buy or sell any security. Click here for more details.

These charts have limitations. Economic data is often revised after the fact. The market is forward looking and anticipates future events. The unexpected can and will happen. The market is continually changing. The conditions of the past are different from the present. Past performance is not an indication of future performance.

Saturday, September 12, 2020

International Leading Indicators - September 2020

The Leading Indicator for International Developed Markets (EFA) is at -6.08% and is 0.53% percentage points higher than last month. The Leading Indicator for International Emerging Markets (EEM) is at 2.21%. 

The OECD released their Leading Indicators for most major countries on Tuesday. 17 of the 20 countries in the Developed Markets had increasing Leading Indices. The Leading Indices increased for 10 out of 15 countries in the Emerging Markets. When available, I have averaged the indicators with the Conference Board's Leading indicators to create a composite for each country. I created Leading Indicators for International Developed Markets (EFA) and International Emerging Markets (EEM) by weighting each country's growth rate by the market share of each country's stocks in the respective funds. On the last chart below, you can click on the blue and red buttons to see the Leading Indicator growth rate and an ETF for various countries.
All information, data and analysis provided by this website is for informational purposes only and is not a recommendation to buy or sell any security.   Click here for more details.

Furthermore, these charts have limitations.  Economic data is often revised after the fact.  The market is forward looking and anticipates future events.  The unexpected can and will happen.  The market is continually changing.  The conditions of the past are different from the present.  Past performance is not an indication of future performance.

Sunday, September 6, 2020

Charting Last Week (8/31/20 - 9/4/20)

The North Star GDP Estimate for the second quarter is -2.59% year over year growth (-17.59% QoQ). The North Star GDP Forecast for the third quarter is at -1.80% year over year growth (24.88% QoQ) up from -1.87% last week. The GDP Forecast page on the tab above is updated periodically during the week.
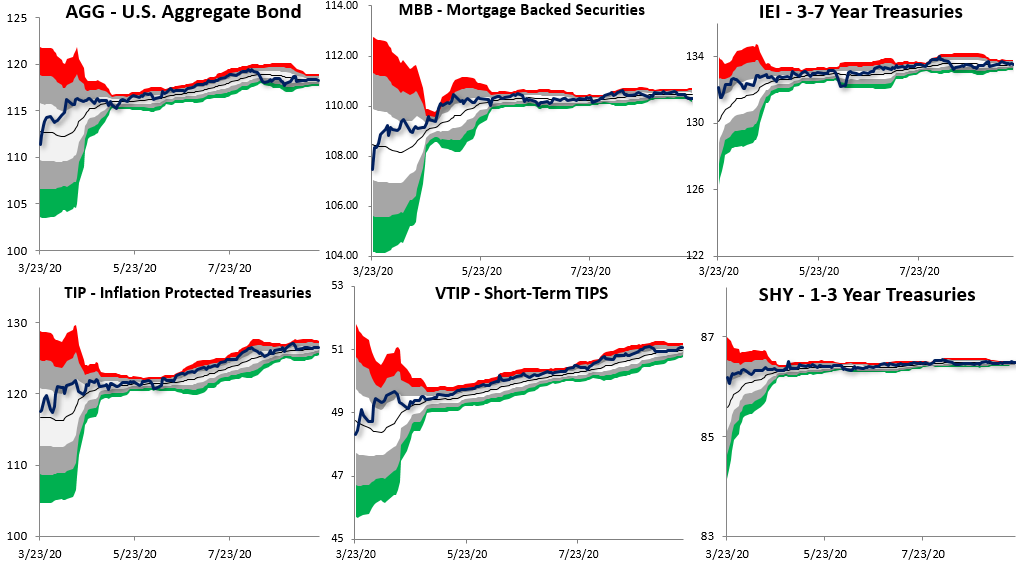
Per yesterday's Unemployment Report, the unemployment rate is 8.4% and the number of unemployed is 13.55 million. Yet, 29.22 million are receiving unemployment benefits. Using the weekly claims data and Gallup's estimate of 44 million self-employed workers, the Unemployment Rate would be 15.4%. On Thursday, the S&P 500 (SPY) suffered its largest decline since June 11. The charts below show the normal trading ranges for various indices for the last six months. The red (or green) area indicates 2-3 standard deviations above (or below) the normal 21 day trading range. The gray area indicates 1-2 standard deviations above (or below) the normal 21 day trading range.
There were not any updates to the International Leading Indices during the week. The Leading Indicator for International Developed Markets (EFA) is at -5.08%. The Leading Indicator for International Emerging Markets (EEM) is at 1.19%. On the chart below, you can click on the blue and red buttons to see the Leading Indicator growth rate and an ETF for each country.
All information, data and analysis provided by this website is for informational purposes only and is not a recommendation to buy or sell any security. Click here for more details.

These charts have limitations. Economic data is often revised after the fact. The market is forward looking and anticipates future events. The unexpected can and will happen. The market is continually changing. The conditions of the past are different from the present. Past performance is not an indication of future performance.