Sunday, September 28, 2014

Charting Last Week (9/22- 9/26/14)

The Daily Leading Index decreased by 3.40% percentage points to 7.79%. The decline was mainly due to new orders for aircraft returning to a normal range after last month's surge. The Daily Coincident Index is at 3.53%. The Daily Leading Index page on the tab above is updated daily during the week.
Equities were down for the week while bond prices were mixed. The charts below show the normal trading ranges for various indices for the last six months. The red (or green) area indicates 2-3 standard deviations above (or below) the normal 21 day trading range. The gray area indicates 1-2 standard deviations above (or below) the normal 21 day trading range.
The Leading Index for the International Developed Markets (EFA) declined by 0.73% percentage points to 0.84%. The Leading Index for International Emerging Markets (EEM) is at 4.20%. On the chart below, you can click on the blue and red buttons to see the Leading Indicator growth rate and an ETF for each country.
All information, data and analysis provided by this website is for informational purposes only and is not a recommendation to buy or sell any security.   Click here for more details.

These charts have limitations.  Economic data is often revised after the fact.  The market is forward looking and anticipates future events.  The unexpected can and will happen.  The market is continually changing.  The conditions of the past are different from the present.  Past performance is not an indication of future performance.

Sunday, September 21, 2014

Charting Last Week (9/15- 9/19/14)

The Daily Leading Index increased by 0.31% percentage points to 11.18%. The Daily Coincident Index is at 3.53%. The Daily Leading Index page on the tab above is updated daily during the week.
The S&P 500 inched farther into record territory while other equity indices were down for the week. Bond prices were mixed for the week. The charts below show the normal trading ranges for various indices for the last six months. The red (or green) area indicates 2-3 standard deviations above (or below) the normal 21 day trading range. The gray area indicates 1-2 standard deviations above (or below) the normal 21 day trading range.
The Leading Index for the International Developed Markets (EFA) declined by 0.02% percentage points to 1.57%. The Leading Index for International Emerging Markets (EEM) is at 4.26%. On the chart below, you can click on the blue and red buttons to see the Leading Indicator growth rate and an ETF for each country.
All information, data and analysis provided by this website is for informational purposes only and is not a recommendation to buy or sell any security.   Click here for more details.

These charts have limitations.  Economic data is often revised after the fact.  The market is forward looking and anticipates future events.  The unexpected can and will happen.  The market is continually changing.  The conditions of the past are different from the present.  Past performance is not an indication of future performance.

Sunday, September 14, 2014

Charting Last Week (9/8- 9/12/14)

The Daily Leading Index increased by 0.18% percentage points to 11.49%. The Daily Coincident Index is at 3.90%. The Daily Leading Index page on the tab above is updated daily during the week.
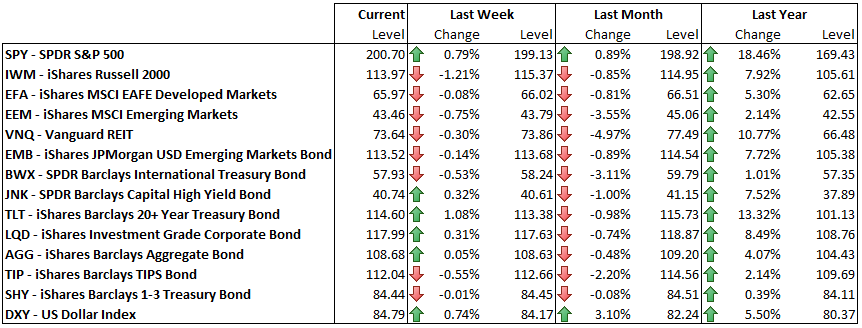
Equity prices fell for the week led by International Emerging Markets (EEM) which declined 4.5% for the week. Bond prices were also down for the week. The charts below show the normal trading ranges for various indices for the last six months. The red (or green) area indicates 2-3 standard deviations above (or below) the normal 21 day trading range. The gray area indicates 1-2 standard deviations above (or below) the normal 21 day trading range.
After last week all of the companies of the S&P 500 have reported Second Quarter earnings. As reported one year earnings for the S&P 500 are up 13.48% year over year. This week seven companies report earnings kicking off the Third Quarter earnings season.

The OECD released their Leading Indicators for most major countries on Monday. When available, I have averaged the indicators with the Conference Board's Leading indicators to create a composite for each country. 17 of the 20 countries in the Developed Markets had declining Leading Indices. The Leading Indices declined for 5 out of 15 countries in the Emerging Markets. The Leading Index for the International Developed Markets (EFA) declined by 0.52% percentage points to 1.59% continuing its steady seven month decline. The Leading Index for International Emerging Markets (EEM) declined to 4.26%. On the chart below, you can click on the blue and red buttons to see the Leading Indicator growth rate and an ETF for each country.
All information, data and analysis provided by this website is for informational purposes only and is not a recommendation to buy or sell any security.   Click here for more details.

These charts have limitations.  Economic data is often revised after the fact.  The market is forward looking and anticipates future events.  The unexpected can and will happen.  The market is continually changing.  The conditions of the past are different from the present.  Past performance is not an indication of future performance.

Tuesday, September 9, 2014

International Leading Indicators - 9/8/14

The Leading Indicator for International Developed Markets (EFA) fell to 1.98% and is 0.35% percentage points lower than last month continuing its steady seven month slide. The Leading Indicator for International Emerging Markets (EEM) rose to 4.45%.

The OECD released their Leading Indicators for most major countries yesterday. 17 of the 20 countries in the Developed Markets had declining Leading Indices. The Leading Indices declined for 5 out of 15 countries in the Emerging Markets. When available, I have averaged the indicators with the Conference Board's Leading indicators to create a composite for each country. I created Leading Indicators for International Developed Markets (EFA) and International Emerging Markets (EEM) by weighting each country's growth rate by the market share of each country's stocks in the respective funds. On the last chart below, you can click on the blue and red buttons to see the Leading Indicator growth rate and an ETF for various countries.

All information, data and analysis provided by this website is for informational purposes only and is not a recommendation to buy or sell any security.   Click here for more details.

Furthermore, these charts have limitations.  Economic data is often revised after the fact.  The market is forward looking and anticipates future events.  The unexpected can and will happen.  The market is continually changing.  The conditions of the past are different from the present.  Past performance is not an indication of future performance.

Sunday, September 7, 2014

Charting Last Week (9/2- 9/5/14)

The Daily Leading Index increased by 0.06% percentage points to 11.30%. The Daily Coincident Index is at 3.90%. The Daily Leading Index page on the tab above is updated daily during the week.
Equities were mixed for the week. The S&P 500 closed the week at another record high. Bond prices were down for the week. The charts below show the normal trading ranges for various indices for the last six months. The red (or green) area indicates 2-3 standard deviations above (or below) the normal 21 day trading range. The gray area indicates 1-2 standard deviations above (or below) the normal 21 day trading range.
There were not any updates to the International Leading Indices during the week. The Leading Index for the International Developed Markets (EFA) is at 2.11%. The Leading Index for International Emerging Markets (EEM) is at 4.39%. On the chart below, you can click on the blue and red buttons to see the Leading Indicator growth rate and an ETF for each country.
All information, data and analysis provided by this website is for informational purposes only and is not a recommendation to buy or sell any security.   Click here for more details.

These charts have limitations.  Economic data is often revised after the fact.  The market is forward looking and anticipates future events.  The unexpected can and will happen.  The market is continually changing.  The conditions of the past are different from the present.  Past performance is not an indication of future performance.

Monday, September 1, 2014

Charting Last Week (8/25 - 8/29/14)

The Daily Leading Index increased by 3.78% percentage points to 11.16%. This large increase was mainly due to a record increase in new orders for aircraft. The Daily Coincident Index declined to 3.90%. The Daily Leading Index page on the tab above is updated daily during the week.
Equities continued their four week recovery. The S&P 500 crossed 2000 for the first time. Bond prices were also up for the week. The charts below show the normal trading ranges for various indices for the last six months. The red (or green) area indicates 2-3 standard deviations above (or below) the normal 21 day trading range. The gray area indicates 1-2 standard deviations above (or below) the normal 21 day trading range.
The Leading Index for the International Developed Markets (EFA) declined by 0.18% percentage points to 2.11% continuing its steady six month decline. The Leading Index for International Emerging Markets (EEM) rose to 4.39%. On the chart below, you can click on the blue and red buttons to see the Leading Indicator growth rate and an ETF for each country.
All information, data and analysis provided by this website is for informational purposes only and is not a recommendation to buy or sell any security.   Click here for more details.

These charts have limitations.  Economic data is often revised after the fact.  The market is forward looking and anticipates future events.  The unexpected can and will happen.  The market is continually changing.  The conditions of the past are different from the present.  Past performance is not an indication of future performance.