The U.S. Bureau of Economic Analysis (BEA) announced on Friday the first estimate of GDP for the second quarter of 2018. GDP grew at a 2.85% year over year rate (4.06% QoQ).
The North Star GDP Estimate for the second quarter is 2.21% year over year growth (1.52% QoQ). The North Star GDP Forecast for the third quarter is at 2.33% year over year growth (0.46% QoQ) up from 2.23% last week. The
GDP Forecast page on the tab above is updated periodically during the week.
The S&P 500 (SPY) rose for the second week in a row and is now 0.96% away from the all-time high set in January. The Fed Funds futures are now implying a 67.7% chance of two more rate hikes this year (up from 61.3% last week) according to CME Group's
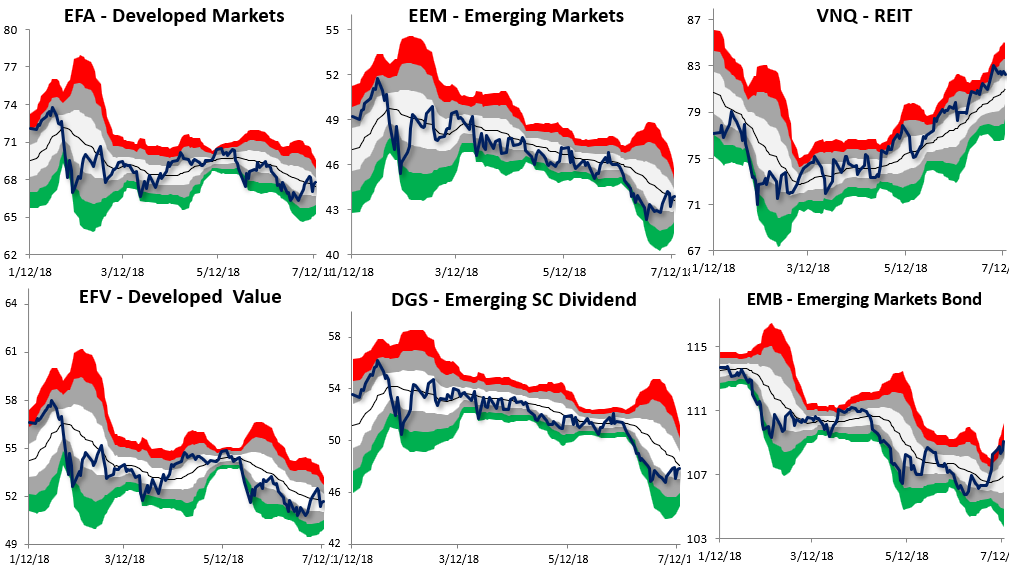
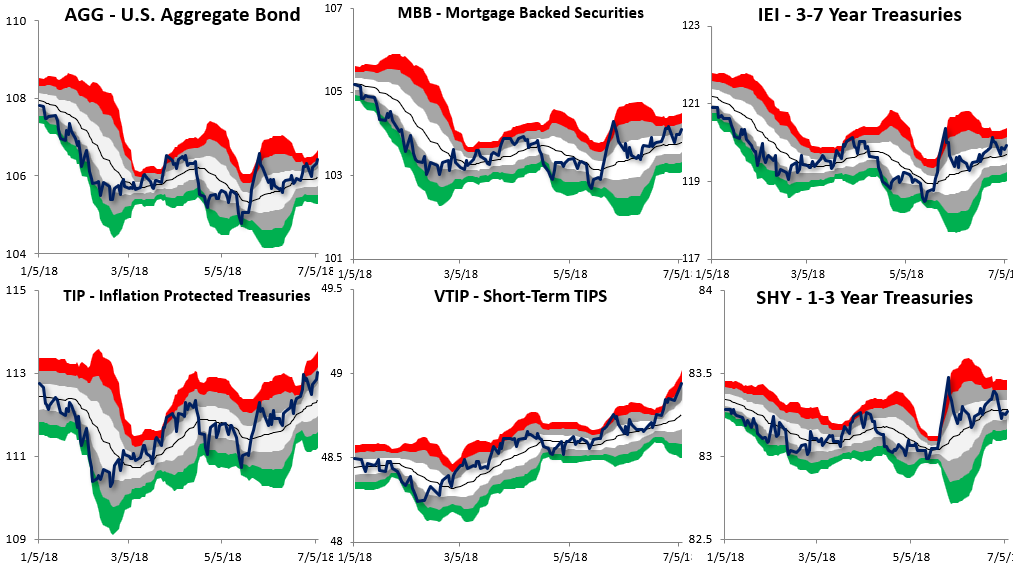
FedWatch tool. The charts below show the normal trading ranges for various indices for the last six months. The red (or green) area indicates 2-3 standard deviations above (or below) the normal 21 day trading range. The gray area indicates 1-2 standard deviations above (or below) the normal 21 day trading range.
The Leading Indicator for International Developed Markets (EFA) decreased by 0.14% percentage points to 1.43%. The Leading Indicator for International Emerging Markets (EEM) is at 5.19%. On the chart below, you can click on the blue and red buttons to see the Leading Indicator growth rate and an ETF for each country.
All information, data and analysis provided by this website is for informational purposes only and is not a recommendation to buy or sell any security. Click here for more details.
These charts have limitations. Economic data is often revised after the fact. The market is forward looking and anticipates future events. The unexpected can and will happen. The market is continually changing. The conditions of the past are different from the present. Past perforance is not an indication of future performance.