Sunday, July 22, 2012

Charting Last Week (7/16 - 7/20/12)

The Daily Leading Index fell by 0.41% to 4.97% after being in a tight range for the last four weeks. The Daily Coincident Index declined by 0.09% to 2.98%. The Daily Leading Index page on the tab above is updated daily during the week.
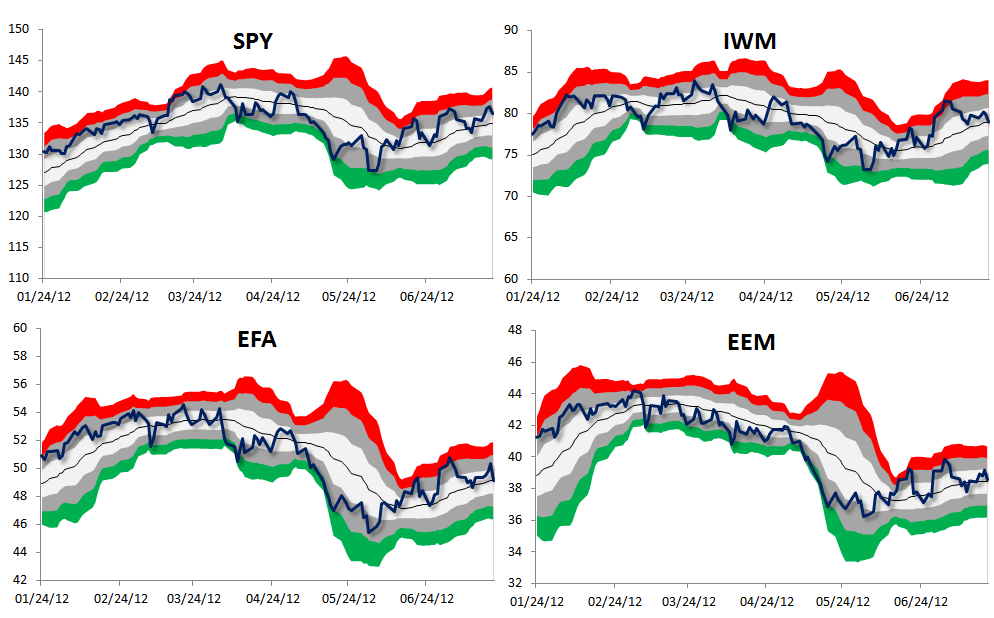
Equities were mixed last week while bonds rallied. The long term Treasuries are up by over 40% year over year. The red (or green) area indicates 2-3 standard deviations above (or below) the normal 21 day trading range. The gray area indicates 1-2 standard deviations above (or below) the normal 21 day trading range.
All information, data and analysis provided by this website is for informational purposes only and is not a recommendation to buy or sell any security.   Click here for more details.

Furthermore, these charts have limitations.  Economic data is often revised after the fact.  The market is forward looking and anticipates future events.  The unexpected can and will happen.  The market is continually changing.  The conditions of the past are different from the present.  Past performance is not an indication of future performance.

Sunday, July 15, 2012

Charting Last Week (7/9 - 7/13/12)

The Daily Leading Index fell by 0.20% to 5.38%. The index has fluctuated in a tight range for the last four weeks. The Daily Coincident Index was flat at 3.06%. The Daily Leading Index page on the tab above is updated daily during the week.
Equities were mostly down for the week while bonds rallied. The red (or green) area indicates 2-3 standard deviations above (or below) the normal 21 day trading range. The gray area indicates 1-2 standard deviations above (or below) the normal 21 day trading range.
All information, data and analysis provided by this website is for informational purposes only and is not a recommendation to buy or sell any security.   Click here for more details.

Furthermore, these charts have limitations.  Economic data is often revised after the fact.  The market is forward looking and anticipates future events.  The unexpected can and will happen.  The market is continually changing.  The conditions of the past are different from the present.  Past performance is not an indication of future performance.

Sunday, July 8, 2012

Charting Last Week (7/2 - 7/6/12)

The Daily Leading Index rose by 0.02% to 5.55% and has now risen slightly for three weeks in a row after falling for 3 weeks in row. The Daily Coincident Index was flat at 3.14%. The Daily Leading Index page on the tab above is updated daily during the week.
Equities retreated from the overbought position while bonds rallied. I have added TLT, a long treasury bond index, and WTI, the Cushing, Oklahoma Crude Oil index, to the charts. TLT is up an impressive 39% year over year. The red (or green) area indicates 2-3 standard deviations above (or below) the normal 21 day trading range. The gray area indicates 1-2 standard deviations above (or below) the normal 21 day trading range.
All information, data and analysis provided by this website is for informational purposes only and is not a recommendation to buy or sell any security.   Click here for more details.

Furthermore, these charts have limitations.  Economic data is often revised after the fact.  The market is forward looking and anticipates future events.  The unexpected can and will happen.  The market is continually changing.  The conditions of the past are different from the present.  Past performance is not an indication of future performance.

Thursday, July 5, 2012

ISM Report on Business - 7/5/12

The June ISM Non-manufacturing index was reported today and was at 52.08, down 1.65% from the previous month. Manufacturing's PMI, which was released on Monday, fell below 50 for the first time since August 2009. A reading below 50 indicates that the sector is contracting but that the economy is still growing. Only 3 of the 10 categories in Manufacturing are above 50. 7 of the 10 categories in Non-Manufacturing are above 50. I have averaged the Manufacturing and Non-manufacturing components to create a composite reading. 5 of the 10 categories in the composite are above 50.
Below is an interactive graph.  You can interact with the graph by choosing what to display.  The INDICATOR category contains all 10 areas surveyed as well as the PMI and NMI composites.  The choices in the MA/NMA category allow you to view the Manufacturing report (MA), the Non-manufacturing report (NMA), and a composite of the two.  The DATES category allows you to view specific periods of time.


All information, data and analysis provided by this website is for informational purposes only and is not a recommendation to buy or sell any security.   Click here for more details.

Furthermore, these charts have limitations.  Economic data is often revised after the fact.  The market is forward looking and anticipates future events.  The unexpected can and will happen.  The market is continually changing.  The conditions of the past are different from the present.  Past performance is not an indication of future performance.

Sunday, July 1, 2012

Charting Last Week (6/25 - 6/29/12)

The Daily Leading Index rose by 0.05% to 5.55% and has now risen slightly for two weeks in a row after falling for 3 weeks in row. However, it is still down 2.06% month over month. The Daily Coincident Index rose to 3.14%. The Daily Leading Index page on the tab above is updated daily during the week.
Equities rallied sharply on Friday posting their biggest gains of the year. Most indices are back in the overbought territory. International Emerging Markets led the way with a 2.55% gain for the week (up 4.43% on Friday). The red (or green) area indicates 2-3 standard deviations above (or below) the normal 21 day trading range. The gray area indicates 1-2 standard deviations above (or below) the normal 21 day trading range.
All information, data and analysis provided by this website is for informational purposes only and is not a recommendation to buy or sell any security.   Click here for more details.

Furthermore, these charts have limitations.  Economic data is often revised after the fact.  The market is forward looking and anticipates future events.  The unexpected can and will happen.  The market is continually changing.  The conditions of the past are different from the present.  Past performance is not an indication of future performance.