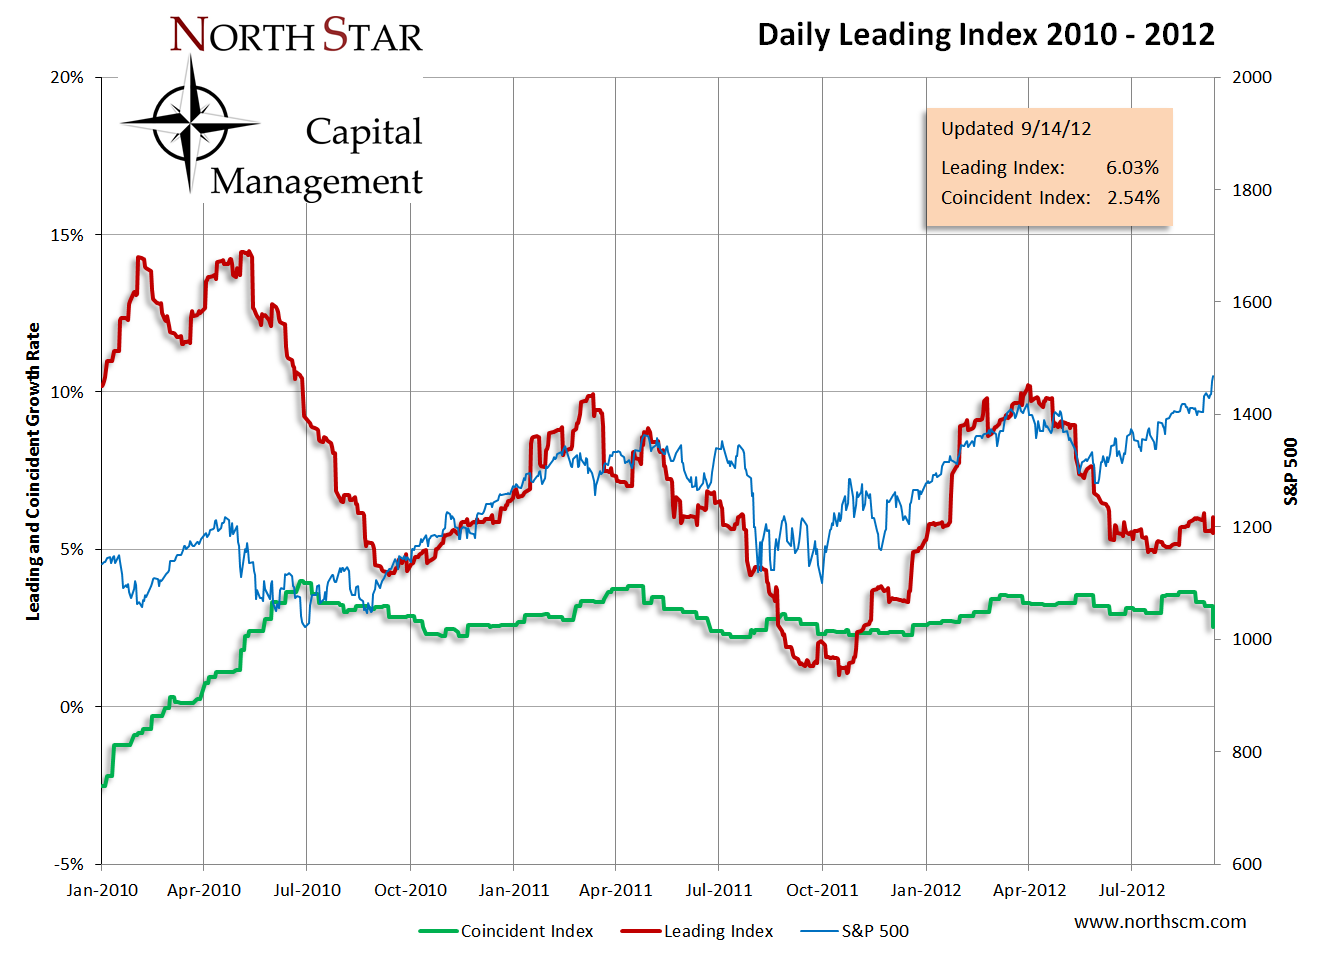
The Daily Leading Index rose by .47% to 6.03% and is now at the top of the tight range it has been in for the last 12 weeks. The Daily Coincident Index fell to 2.54%. The
Daily Leading Index page on the tab above is updated daily during the week.
Equities posted strong gains for back to back weeks. All the equity indices are in the overbought territory. SPY (S&P 500) is at an all time high and is now 3.7% higher than the 2007 highs. TLT (Barclays 20+ Year Treasury Bond) is now in the oversold territory. The red (or green) area indicates 2-3 standard deviations above (or below) the normal 21 day trading range. The gray area indicates 1-2 standard deviations above (or below) the normal 21 day trading range.
All information, data and analysis provided by this website is for informational purposes only and is not a recommendation to buy or sell any security. Click here for more details.
Furthermore, these charts have limitations. Economic data is often revised after the fact. The market is forward looking and anticipates future events. The unexpected can and will happen. The market is continually changing. The conditions of the past are different from the present. Past performance is not an indication of future performance.