The North Star GDP Estimate for the first quarter is 2.27% year over year growth (-1.61% QoQ). The North Star GDP Forecast for the second quarter is at 1.86% year over year growth (2.48% QoQ) up from 1.77% last week. The
GDP Forecast page on the tab above is updated periodically during the week.
S&P 500 (SPY) rebounded on Friday and closed the week in record territory. The Fed Funds futures are now implying a 47.0% chance that the Fed will cut rates in 2019 (down from 65.8% last week) according to CME Group's
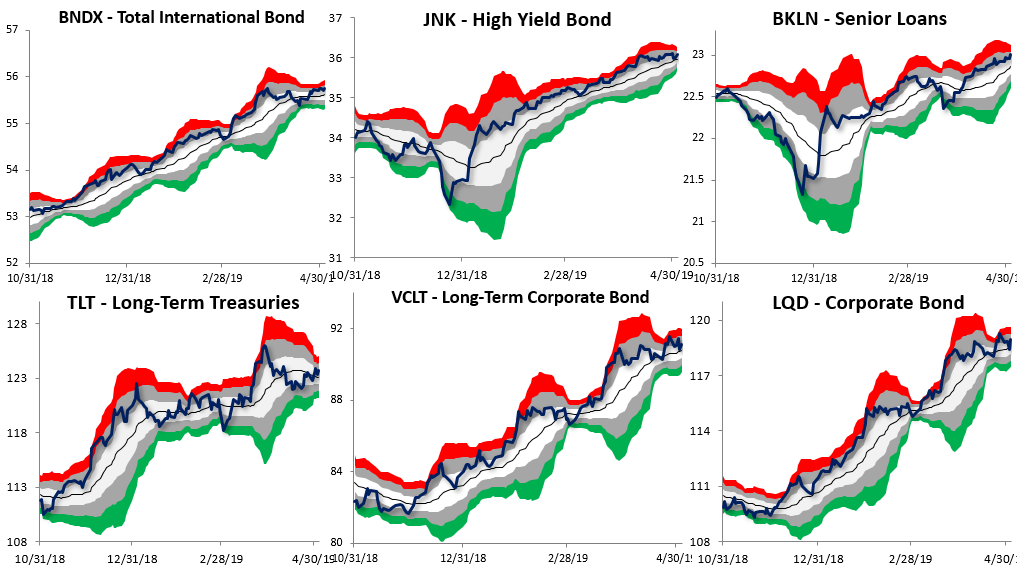
FedWatch tool. The charts below show the normal trading ranges for various indices for the last six months. The red (or green) area indicates 2-3 standard deviations above (or below) the normal 21 day trading range. The gray area indicates 1-2 standard deviations above (or below) the normal 21 day trading range.
There were not any updates to the International Leading Indices during the week. The Leading Indicator for International Developed Markets (EFA)is at -0.66%. The Leading Indicator for International Emerging Markets (EEM) is at 4.00%. On the chart below, you can click on the blue and red buttons to see the Leading Indicator growth rate and an ETF for each country.